How the savings calculator works
The calculator does not guess. Every figure comes from a fixed model built from tested, cited sources and checked to the penny. This page walks through how each number is reached, in plain language, so you can see the working and judge it for yourself.
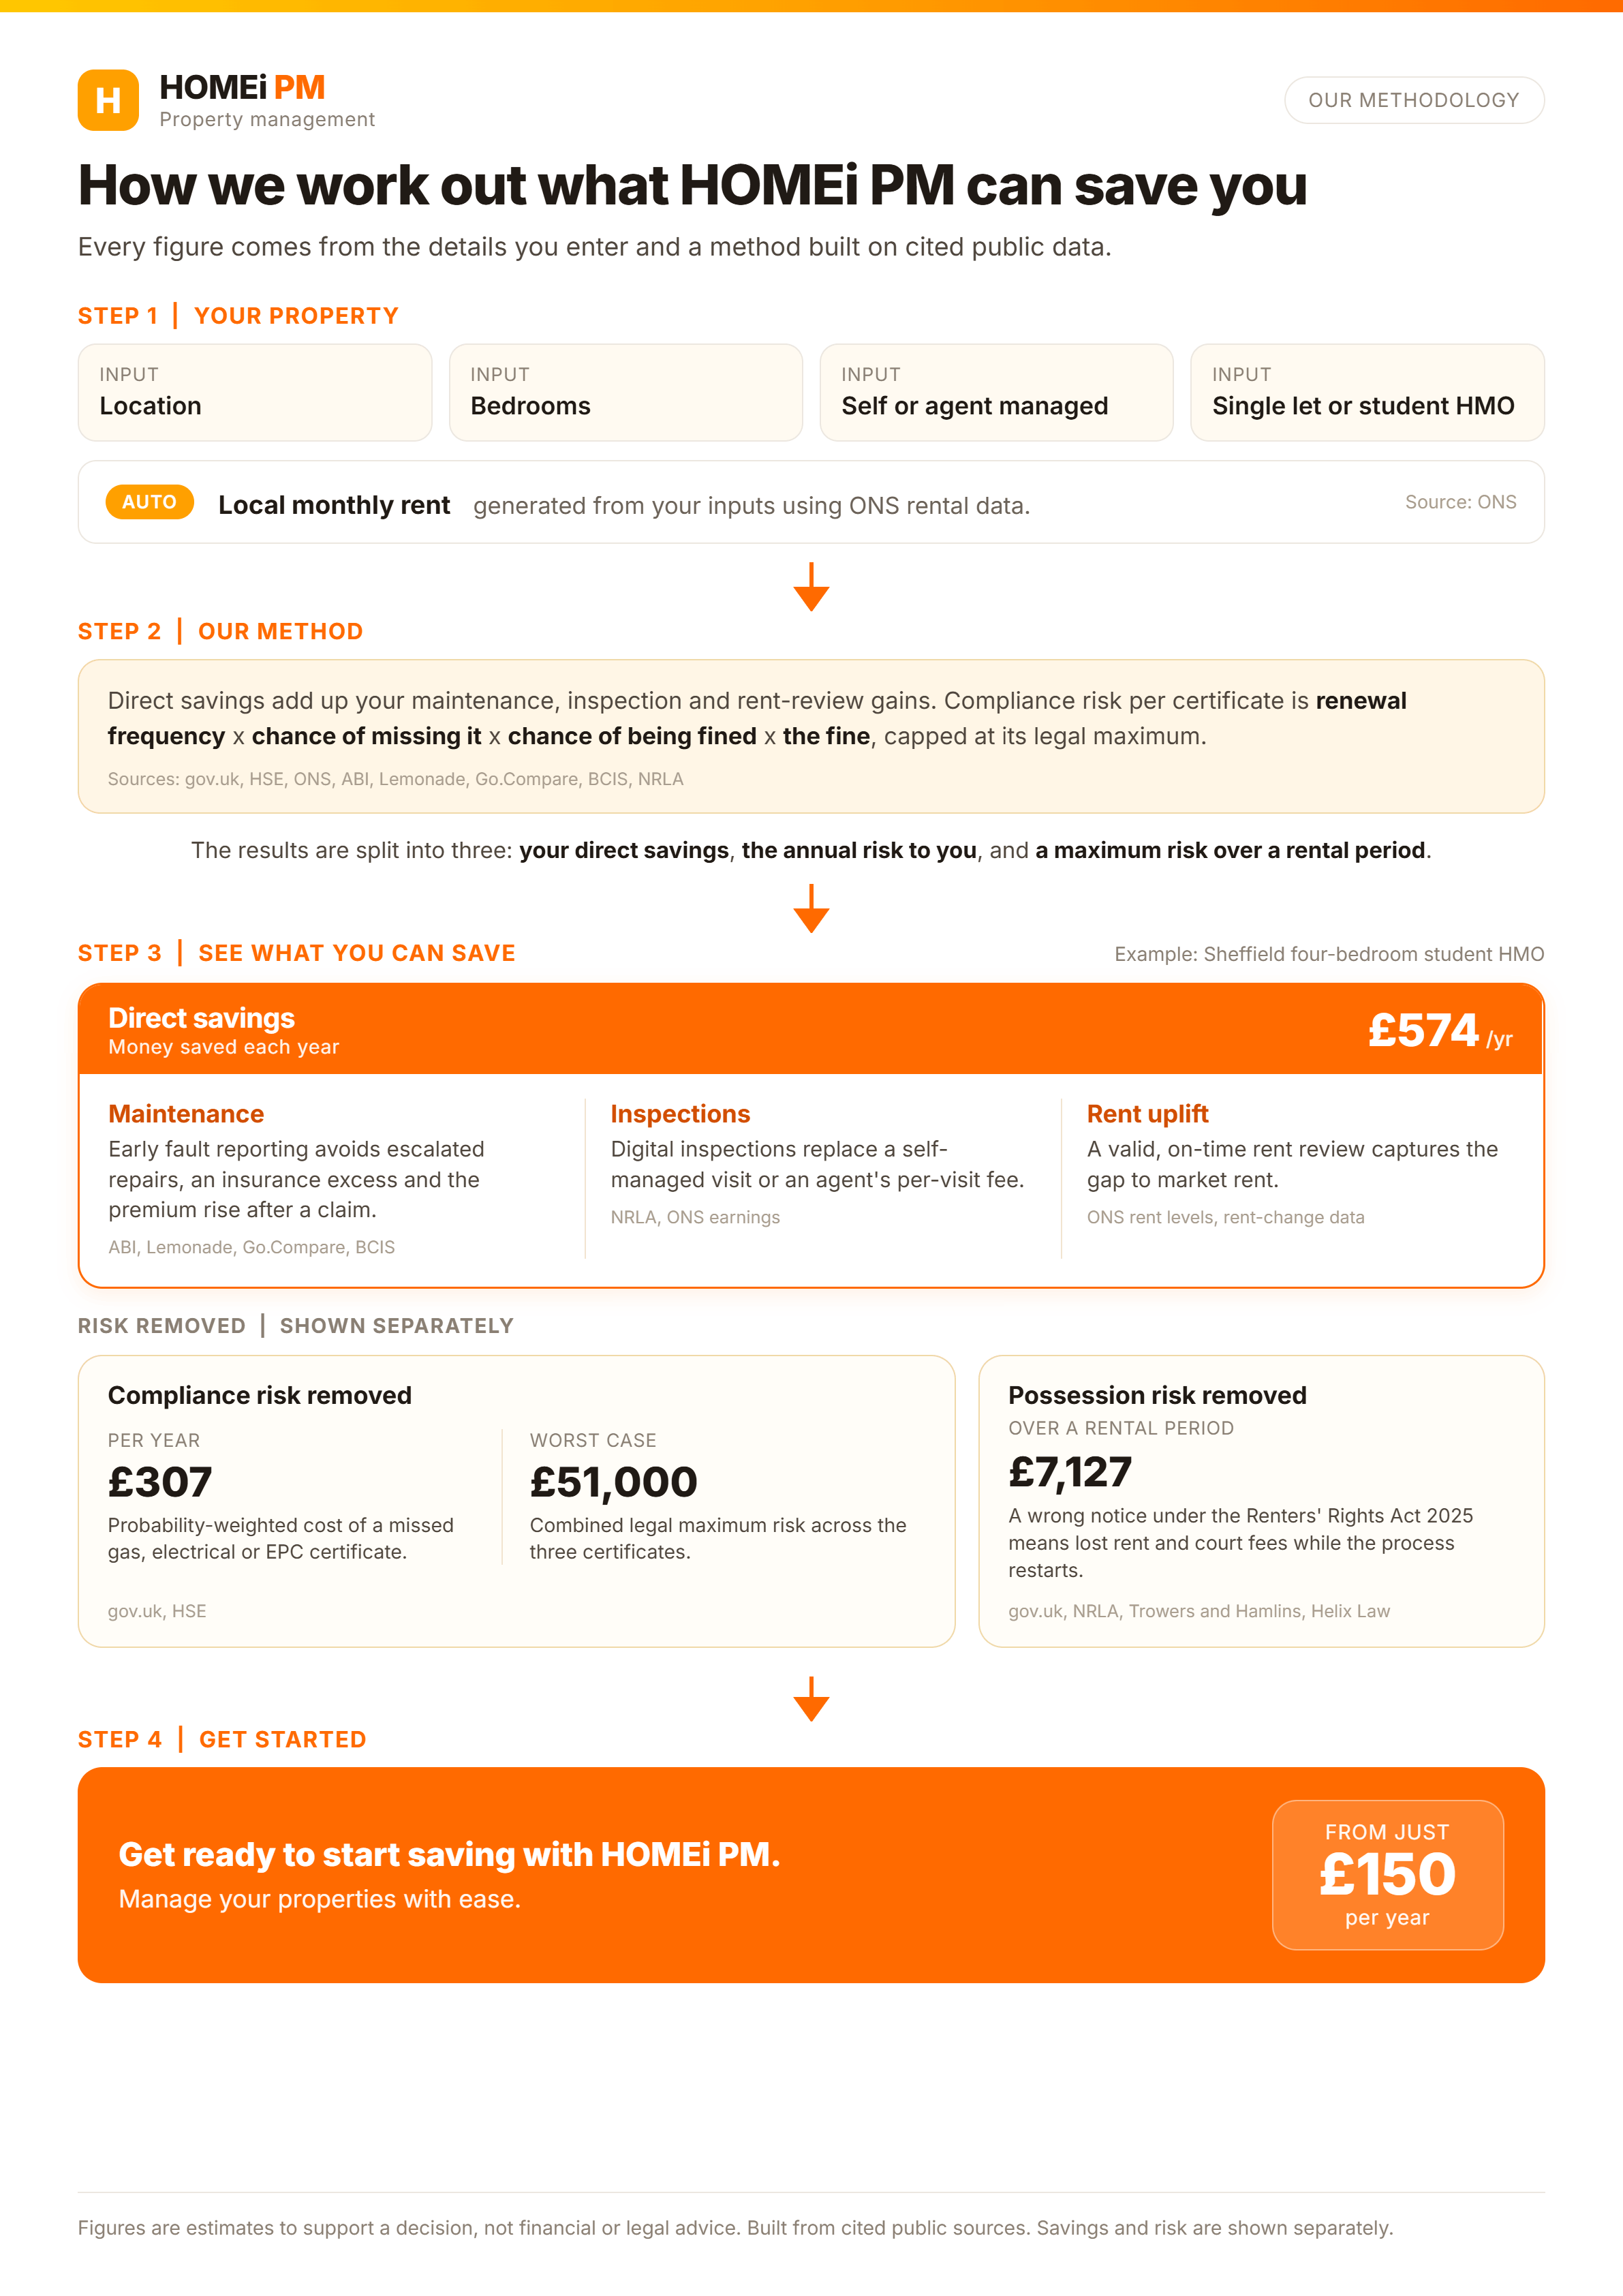
Three things to hold in mind before the detail.
Direct savings and risk are kept separate. One is cash you keep each year. The other is what is at stake if something goes wrong. We never add them together.
Compliance risk uses a realistic expected cost, not the maximum fine. And every figure is worked out three times, for a cautious low case, a middle base case, and a high case, so you see a range rather than a single false-precise number.
The four inputs
You give the calculator four things: your location, the number of bedrooms, whether you manage the property yourself or through an agent, and whether it is a single let or a student HMO. All four are fixed choices, so the model always knows exactly which numbers to use. Nothing is typed in free text, which means the lookup can never miss.
Each input changes the sum in a specific way. Location and bedrooms set your rent. Management decides how the inspection saving is worked out. Property type decides whether the student HMO adjustments apply.
The rent lookup
The calculator finds the median monthly rent for your chosen local authority and bedroom count. That rent then drives the rent uplift and the possession figures further down. If we do not hold a rent for a particular combination, the calculator says so plainly rather than showing a misleading zero.
Source: Office for National Statistics private rental market statistics, by local authority and bedroom category. These are official median rents, not estimates.
The maintenance saving
Catching a problem early is cheaper than fixing the damage later. The clearest example is water. A slow leak or a failing seal, spotted at an inspection, is a small repair. Left unseen, it becomes a claim, an excess payment, and years of higher insurance premiums.
The model works out how likely a preventable water-damage event is in a year, then how much of that is genuinely avoidable through regular inspection. It applies that likelihood to two things: the insurance excess you would pay, and the extra premium you would carry for several years after a claim. It then adds the smaller, more frequent repairs that sit below the excess and never reach an insurer at all. For a student HMO, where there are more people and more wear, the model scales this up.
Sources: Association of British Insurers data on escape-of-water claims and their frequency, typical buildings insurance excess levels, and published guidance on how claims affect future premiums.
The inspection saving
This is the most direct saving, and it depends on how you manage the property.
If an agent handles your inspections, you pay a fee each time. HOMEi PM runs the inspection through the tenant's app instead, so the saving is simply the agent fee you no longer pay, across the inspections you do each year.
If you inspect the property yourself, the cost is your time and your travel. The model values the hours you spend driving, walking the property, and writing it up, then subtracts the much smaller amount of time it takes to review a guided digital inspection your tenants have already completed. The difference, across the year, is the saving.
Sources: Typical letting-agent inspection fees, HMRC approved mileage rates for travel, and a conservative hourly value for a landlord's own time.
The rent uplift
Under the Renters' Rights Act, rent rises happen through a Section 13 notice on the correct form. Landlords who track the market and serve a proper notice keep their rent in step. Landlords who forget, or who get the process wrong, quietly fall behind.
The model estimates the rent you would otherwise leave on the table over a couple of months of the year, using your actual local rent and a modest growth rate. It is deliberately cautious. This is about keeping pace with the market, not pushing rents beyond it.
Sources: ONS rental growth figures and the Section 13 procedure set out on GOV.UK.
Expected annual compliance risk
There are three certificates that matter most: the gas safety record (CP12), the electrical report (EICR), and the energy performance certificate (EPC). Miss one and you can face a fine.
Rather than quoting the maximum fine, which would be alarmist, the model works out a realistic yearly figure. For each certificate it takes how often it tends to lapse, multiplies by how often a lapse is actually caught and fined, multiplies by the size of the fine, and spreads that across the certificate's renewal cycle. Add the three together and you get the expected annual compliance risk. It is the honest, everyday number, not the worst case.
Sources: GOV.UK penalty levels for gas, electrical and EPC breaches, certificate renewal cycles set in regulation, and published local-authority enforcement rates.
Worst-case exposure
Separately, the calculator shows the rare worst case, so you can see the full size of what is at stake. If all three certificates lapse and are caught, the combined maximum fines reach a fixed ceiling. This is not a cost you expect in a normal year. It is the downside HOMEi PM is there to keep off the table.
Source: The statutory maximum penalties for each certificate, added together.
Possession protection
If you need to recover your property and the paperwork is not in order, the delay costs money. The possession figure adds up three things: the rent you lose while you sort out and re-serve a notice, the court fee wasted if a claim fails on a technicality, and, for a student HMO, the value of the months lost if you miss the Ground 4A window and cannot re-let for the new academic year.
For a single let, Ground 4A does not apply, so that part is zero and the calculator does not show it. Everything here uses your real local rent, so the figure reflects your property, not a national average.
Sources: Current court fees for possession claims on GOV.UK, the Ground 4A student possession rules under the Renters' Rights Act, and your local ONS rent.
A note on what these figures are
These are estimates to help you make a decision. They are not financial advice or legal advice. The probabilities in the model describe how the model works. They are not a promise about your specific property. Direct savings and risk are shown separately and are never added together, and compliance risk uses a realistic expected cost rather than the maximum fine.
Before taking any step with legal or financial consequences, check the current position on GOV.UK and take advice from a qualified professional.
Last updated: 2 July 2026. Sources: Office for National Statistics, the Association of British Insurers, HMRC, and GOV.UK. Full citations available on request.